

Assessing Safety Risks for CO2 Pipelines
Carbon Capture and Storage (CCS) is expected to be a key method in reducing carbon dioxide emissions. It is envisaged to be used in traditional energy settings to reduce and offset carbon emissions, and for renewable energy production, such as ‘blue hydrogen’, which is derived from natural gas.
Pipelines are an efficient method to transport carbon dioxide from the production site to the storage/offloading location. Shipping carbon dioxide as a liquid is also being considered, in addition to pipelines. However, given existing pipeline networks – particularly those already linked to depleted reservoirs – this presents an opportunity to re-purpose pipelines and use reservoirs as carbon stores. This article presents an overview of the safety aspects relating to accidental release from a carbon dioxide pipeline, particularly focusing on the key challenges and uncertainties.
Penspen have extensive experience in pipeline Quantitative Risk Assessments (QRAs), including for hydrogen and carbon dioxide.
Risk Assessment
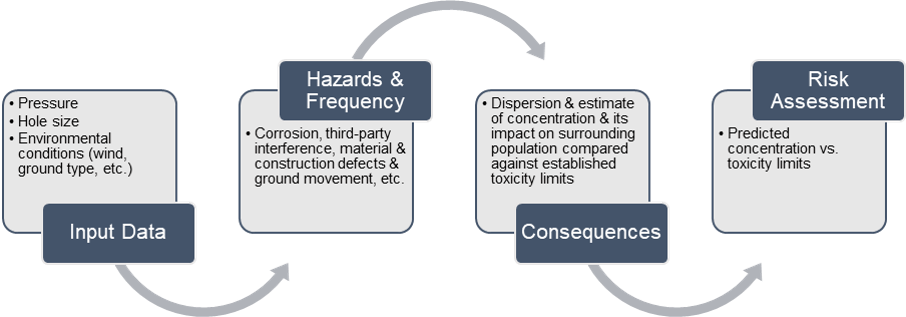
A generic risk assessment process, based on a quantitative risk methodology, is shown below. This is used in subsequent sections to discuss pertinent aspects.
Pipeline Operating Pressure
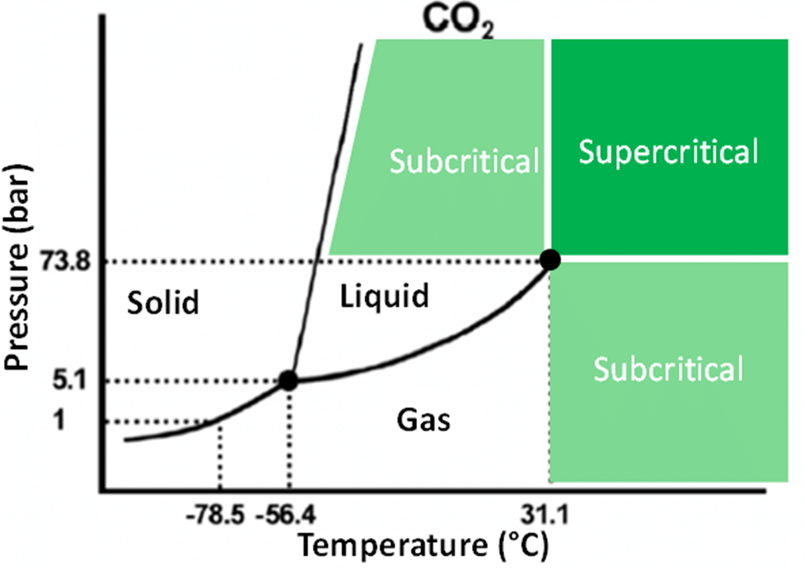
Carbon dioxide pipelines typically operate in the supercritical or dense phase. This means the fluid has a liquid-like density but a gas-like gas viscosity and compressibility, resulting in transport that is more efficient. If transported in its gaseous phase, the reduced density would require larger pipelines with higher pressure drops. This could be feasible for shorter pipelines but inefficient for longer distances. As a consequence of this, the CO2 stream would be compressed above the critical pressure, which is typically around 74 barg (varies depending on impurities and equation of state used). The net impact from this is that, generally, CO2 pipelines are expected to operate at higher pressures compared to current natural gas systems. As a result, the pipeline wall thickness is larger, compared to a natural gas pipeline.
Fluid Composition
Establishing the fluid composition is of critical importance. Given the relatively nascent nature of CCS, this may not be well defined until later design stages. There are typically three sources of carbon dioxide: pre-combustion, post-combustion and oxy-fuel combustion. Typical compositions for each are widely available from literature, although there are differences in the amount of impurities. From a safety perspective, the main concern is those with high toxicity, in particular, sulphur dioxide (SO2) and hydrogen sulphide (H2S).
Pipeline Material
The impact of transporting CO2 on pipeline steel grade is an active area of research. One of the key considerations is ductile running fracture. Though also possible in natural gas pipelines, this is a particular concern for CO2 pipelines, owing to its thermo-physical properties. To prevent ductile running fractures, the decompression speed of the fluid needs to be higher than the fracture propagation speed of the pipeline wall. So, if the decompression speed outruns the fracture propagation speed, the fracture is arrested. The issue with CO2 is the step change in decompression speed as the pressure reduces to the liquid-vapour line. This has a significant impact on the pressure evolution behaviour making running ductile fractures a bigger concern for CO2 pipelines compared to natural gas pipelines [11]. It has been shown that the traditional two-curve method (based on research by Battelle) used for natural gas pipelines is not strictly applicable to CO2 pipelines. Industry guidance is continually developing in this area, with more advanced methods, employing numerical simulation to better predict the behaviour to ensure the pipe wall is sufficient.
As for the materials and steel grade itself, these must be compatible with all states of CO2, including very low temperatures in case of a rapid depressurisation. Dense CO2 behaves as a solvent with certain materials and for instance, diffuses into polymers [11]. This is more of a concern for non-linepipe material, such as valves, flanges, and fittings, etc.
Internal Corrosion
This is mainly a concern in the presence of water, which would react with the CO2, resulting in carbonic acid. Operational experience to date suggests that dewatering of the incoming CO2 mixture can effectively control this. Based on an extensive literature survey of CO2 composition in a CCS context, the level of water is negligible. Nevertheless, this should be assessed and requirements for dewatering facilities should be suitably selected. The production process/route of the CO2 should be assessed for risk of water entering the pipeline. This should account for planned operational procedures and choice of material, all of which will be selected to mitigate against corrosion risk from water. This would then better inform the probability of failure. It is also noted that there is significant experience in dealing with CO2 corrosion.
Probability of Failure
Given the relatively low number of CO2 pipelines in operation, specific failure data is very limited and the cumulative experience is not sufficient for direct application. Estimates of the total length of CO2 pipelines globally range from 2,600km to 6,300km [12], with the majority in the USA. The data for hydrocarbon pipelines is used often and which is much more extensive and generally accepted [5] [6].
This is an area of ongoing research where the additional and unique challenges of CO2 transport are attempted to be captured [1] [8], however this is ultimately contingent on actual operational experience. One of the key issues with using natural gas pipeline data is the applicability of the underlying assumptions, in particular the maximum wall thickness [1]. For CO2 transport, the pressure is expected to be higher, requiring higher wall thicknesses. These would generally be outside of the limits of the equations/approaches used for natural gas pipelines. One study also demonstrated that using the natural gas statistics is “cautious” [6].
It is also useful to assess the overall failure statistics for natural gas pipelines. Third-party interference is the most common cause, followed by corrosion. Third-party risks are equally applicable and valid to any pipeline, irrespective of transported medium, although the risk of a rupture would be reduced for thicker-walled pipelines.
The use of failure statistics for natural gas pipelines is considered adequate for preliminary risk assessments. Other aspects, such as assessment of water content removal, may also be performed to quantify the risk of it entering the CO2 stream.
The guidance in IGEM TD/2 [9] can be used to derive baseline failure probabilities based on pipeline OD and wall thickness. Consideration for project specific inputs should be made to assess applicability.
Consequence of Failure
The consequence from an accidental release is perhaps the most distinct aspect (compared to natural gas) for carbon dioxide pipelines. CO2 is transported in its supercritical phase. This has a significant impact on the consequence modelling complexity, owing to the phase changes the fluid undergoes upon depressurisation.
Carbon dioxide is not classified as a toxic substance by HSE UK; however, it still poses a lethal threat to life. There have not been many accidents from man-made facilities, although natural events – such as the limnic eruption at Lake Nyos in Cameroon (1986) and Mount Vesuvius’ eruption in Pompeii (AD 79) – clearly demonstrate the dangers of CO2. At Lake Nyos, thousands of tons of CO2 were released, which eventually descended on nearby villages, displacing all the air and resulting in suffocation and nearly 2,000 deaths. Being denser than air (by x1.5), CO2 poses distinct hazards, particularly at low points. Depending on the topography, this can be a significant factor.
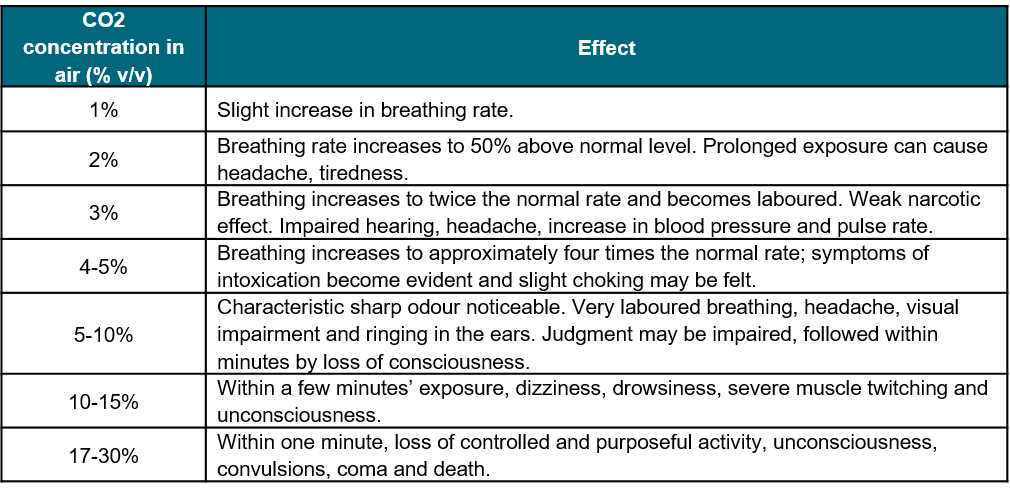
Hydrocarbon pipelines pose an ignitable hazard, whereas this is not the case with CO2. This has implications around the methodology and existing pipeline industry guidelines, which are tailored to hydrocarbon ignition/explosion risk. Inhalation of CO2 is the main risk and its severity on humans depends on its concentration and exposure time. The table below presents the typical effect on humans exposed to varying concentration of CO2 in air [5].
To model the consequence of an accidental release, dispersion modelling is performed. There are various techniques and methods available, from empirical correlation and integral models, to computational fluid dynamic simulation. Integral models are generally the most versatile for use in risk assessments, allowing for fast run-times and having been benchmarked with experimental data. CFD tools are increasingly being used, although they remain highly complex to set up and can be time-consuming to run, requiring significant computing resources. However, they are the best tool if the terrain is a major factor, in which case other methods are deficient.
Equation of State
One of the critical inputs is the equation of state. For CO2, its choice is not straightforward. Significant research has been done on investigating the most suitable equation. A discussion on the various versions and their performance is not the subject of this article but it is a key input to any modelling. This is particularly important where there are impurities, which can affect the critical pressure/temperature. This also drives the simulation of the change in states during depressurisation; in particular, the formation of CO2 ice can be important.
Toxicity Limits
There are various methods to determine harm from a hazard, such as Dangerous Toxic Load (DTL), probit and concentration [12]. The DTL and probit methods are based on fatality, whilst concentration applies a limiting value based on acceptable injury/harm. For a risk assessment, the chance of fatality is of more importance and so the DTL or probit approaches are more suitable.
To determine the toxicity limits, both the concentration and exposure time must be considered. This is commonly achieved through the probit equation. HSE UK have published a report with the probit equation for CO2 [4]. Similar probit equations can be determined for other substances, such as H2S.
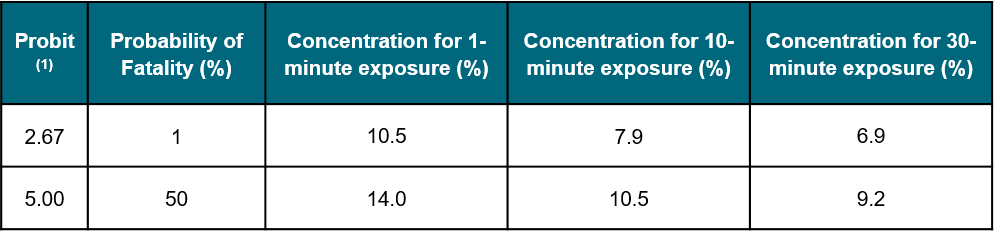
The guidance from HSE UK’s DTL can be used to derive a probit equation [3]. This provides the toxic load for Specified Level of Toxicity (SLOT) and Significant Likelihood of Death (SLOD) criteria. The former typically relates to a 1% fatality rate (or lethality), whilst for the latter it is 50%. These are combined to derive a CO2-specific probit equation [4], shown below, where ‘C’ is the concentration of CO2 in air (ppm) and ‘t’ is the exposure time (minutes):

This can be used to estimate the probability of fatality as a function of concentration. A selected sample of results is summarised in the table below:
Notes:
- Following on from the mathematical definition of the probit function, a probit value of 2.67 corresponds to a fatality rate of 1%, whilst a probit value of 5.00 corresponds to a fatality rate of 50%.
Inclusion of toxic impurities is equally important, though it depends on the expected concentration. H2S is one that is known to be highly toxic. Even at 100 ppmv, it has the potential to be lethal and should be included in the risk assessment if expected to be present. H2S concentration of up to 3% have been reported for CCS related CO2 compositions. SO2 is also highly toxic but generally its quantity is low (<100 ppmv) for the expected CO2 composition for CCS applications.
The probit approach is used to calculate the probability of death as a function of distance away from the leak. In turn, this can be used to calculate individual risk values.
Case Study
A brief case study is presented to demonstrate key results. DNV PHAST software has been used for the consequence analysis (an integral method type). Key input parameters of a ‘typical’ pipeline are shown in the table below:

Notes:
- Heavy wall thickness at critical locations with higher design factor
- Based on Pasquill stability classes, D refers to ‘neutral’ conditions & F refers to ‘moderately stable conditions’. For both a wind speed of 2 m/s is used – hence ‘D2’ & ‘F2’.
Various cases were run, including sensitivities on several input parameters. The following is a summary of the some of the key findings:
- Baseline distance to a 6.9% concentration contour was found to be 85m downwind of the pipeline rupture (assumes a vertical release and ‘2F’ weather conditions). Beyond 85m, the CO2 concentration at ground level does not exceed 6.9% (by volume). The toxic lethality results combine concentration with exposure time. The resulting distance using the HSE UK SLOT criterion (1% fatality) was 60m, i.e. within 60m there is a 1% fatality rate.
- If one assumes a 100m leak hole size (instead of a full-bore rupture), this increases the equivalent distance to 145m. This may seem counter-intuitive at first, however, due to a lower momentum jet release, more CO2 is found at ground level with less mixing with the atmosphere at elevation. The SLOT distance also increases to 170m.
- Assuming 3% H2S impurity requires the probit equation to be modified accordingly. This has a big impact on the toxicity results, where the toxicity of the H2S dominates that from CO2. Using the HSE UK SLOT criterion (1% fatality), the downward distance increases from 60m to 2,900m. However, it is noted 3% H2S is considered very conservative. Nevertheless, this does demonstrate its impact on the results.
- The consequence results can be used to determine the risk values, which accounts for the failure frequency. The risk values are then compared to acceptability limits. Using IGEM TD/2 guidance [9], increased wall thickness results in a lower failure probability (for ruptures), which reduces the risk values.
- Where the risk exceeds the limits, mitigation measures can be considered. These include increased burial depth, concrete slabbing, inter-mediate isolation valves etc. The consequence modelling is then re-run to repeat the analysis until the risk values are acceptable.
Specific industry guidance for pipeline CO2 QRAs remains to be fully developed, though the general framework from natural gas pipelines can be used with qualifying assumptions. Several JIPs have been performed to better inform the process, particularly around the consequence modelling, which is the main challenge with CO2. In addition, the lack of data availability on failure frequencies is also a key source of uncertainty. This cannot be resolved until more operational experience is gained. Pragmatically, careful use of natural gas statistics is considered acceptable, coupled with sensitivities, to ensure a robust assessment.
References
- J. Lyons, J.M. Race, B. Wetenhall, E. Chang, H.F. Hopkins, J. Barnett, “Assessment of the Applicability of Failure Frequency Models for Dense Phase Carbon Dioxide Pipelines”, International Journal of Greenhouse Gas Control – Vol. 87 (pp. 112-120), 2019
- HSE UK, “Assessment of the major hazard potential of carbon dioxide (CO2)”, 2011
- HSE UK, “Toxicity levels of chemicals”, https://www.hse.gov.uk/chemicals/haztox.htm (accessed March 2021)
- HSE UK, “Comparison of risks from carbon dioxide & natural gas pipelines”, RR749, 2009
- Energy Institute, “Technical guidance on hazard analysis for onshore carbon capture installations and onshore pipelines” – 1st Edition, 2010
- Cooper, J. Barnett, “Pipelines for transporting CO2 in the UK”, Energy Procedia 63 (pp. 2412-2431), 2014
- British Geological Survey, “National seismic hazard maps for the UK: 2020 updated”, Open Report OR/20/053, 2020
- Joris Koornneefa, Mark Spruijt, Menso Molagb, Andrea Ramíreza, Wim Turkenburga, André Faaij, “Quantitative risk assessment of CO2 transport by pipelines—A review of uncertainties and their impacts”, Journal of Hazardous Materials – Vol. 177 (pp. 12-27), 2009
- Institute of Gas Engineers & Managers, IGEM TD/2 Edition 2 with amendments, Assessing the risks from high pressure Natural Gas pipelines, 2015
- B. Cunha, “Comparison & Analysis of Pipeline Failure Statistics”, ASME, IPC2012-90186, 2012
- Det Norske Veritas, “Design & Operation of CO2 Pipelines”, DNV RP J202, 2010
- McGillivray, J.L. Saw, D. Lisbona, M. Wardman. M. Bilio, “A risk assessment methodology for high pressure CO2 pipelines using integral consequence modelling”, Process Safety & Environmental Protection – Vol. 92 (pp. 17-26), 2014
- J. Wilday,J.L. Saw, “CO2 Pipelines Good Practice Guidelines – Technical Report”, WP 3.1 – FP7 Project CO2 PipeHaz, 2013
- “Requirements for Safe & Reliable CO2 Transportation Pipeline”, European Commission, SARCO2 (EUR 28918), 2017
Insights & News
Managing Electrical Interferences in Pipelines – A Practical and Cost-Effective Approach
The rapid expansion of AC/DC transmission networks, electrified transportation systems and pipeline infrastructure has increased the spatial overlap among these...

Growth Across Borders: Meet Nilesh
A lifelong passion for continuous improvement has seen Nilesh soar in his career. Now, as Principal Mechanical Engineer at Penspen, he's using his experience to mentor graduate...

Engineering Intelligence: The Women Building Digital Careers in Energy
On International Women’s Day, we talk to two software engineers about how data is transforming how engineers work, the personal qualities required for a role in software development, and why their...

Exceedance Probability Modeling in Pipeline Integrity Using Big Data Techniques for Crack Type Anomalies
In our latest technical insight, Penspen Asset Integrity experts explore how exceedance probability modelling and big data techniques can be applied to crack-type anomalies to support risk-based...

Penspen Latin America Director Appointed to AMPP Global Technical Advisory Committee
International engineering consultancy Penspen is pleased to announce that Gustavo Romero, Director – Operations (LATAM), has been appointed to the Global Technical Advisory Committee (GTAC) of the...

Penspen Launches Three New Asset Integrity Training Courses in the Middle East & Africa Region
Penspen has launched three new Asset Integrity online training courses across the Middle East & Africa (MEA) region, supporting operators in strengthening pipeline integrity and managing ageing...
Penspen Awarded Hydrogen Transition Pathways for Industrial Clusters Study
International energy consultancy Penspen has been awarded a critical research project designed to look into how hydrogen can support the transition of the UK’s industrial clusters. Hydrogen...
More insights
-
Managing Electrical Interferences in Pipelines – A Practical and Cost-Effective Approach
The rapid expansion of AC/DC transmission networks, electrified transportation systems and pipeline infrastructure has increased the spatial overlap among these assets.…
Read insight -

Growth Across Borders: Meet Nilesh
A lifelong passion for continuous improvement has seen Nilesh soar in his career. Now, as Principal Mechanical Engineer at Penspen, he's using his experience to mentor graduate engineers.…
Read insight